
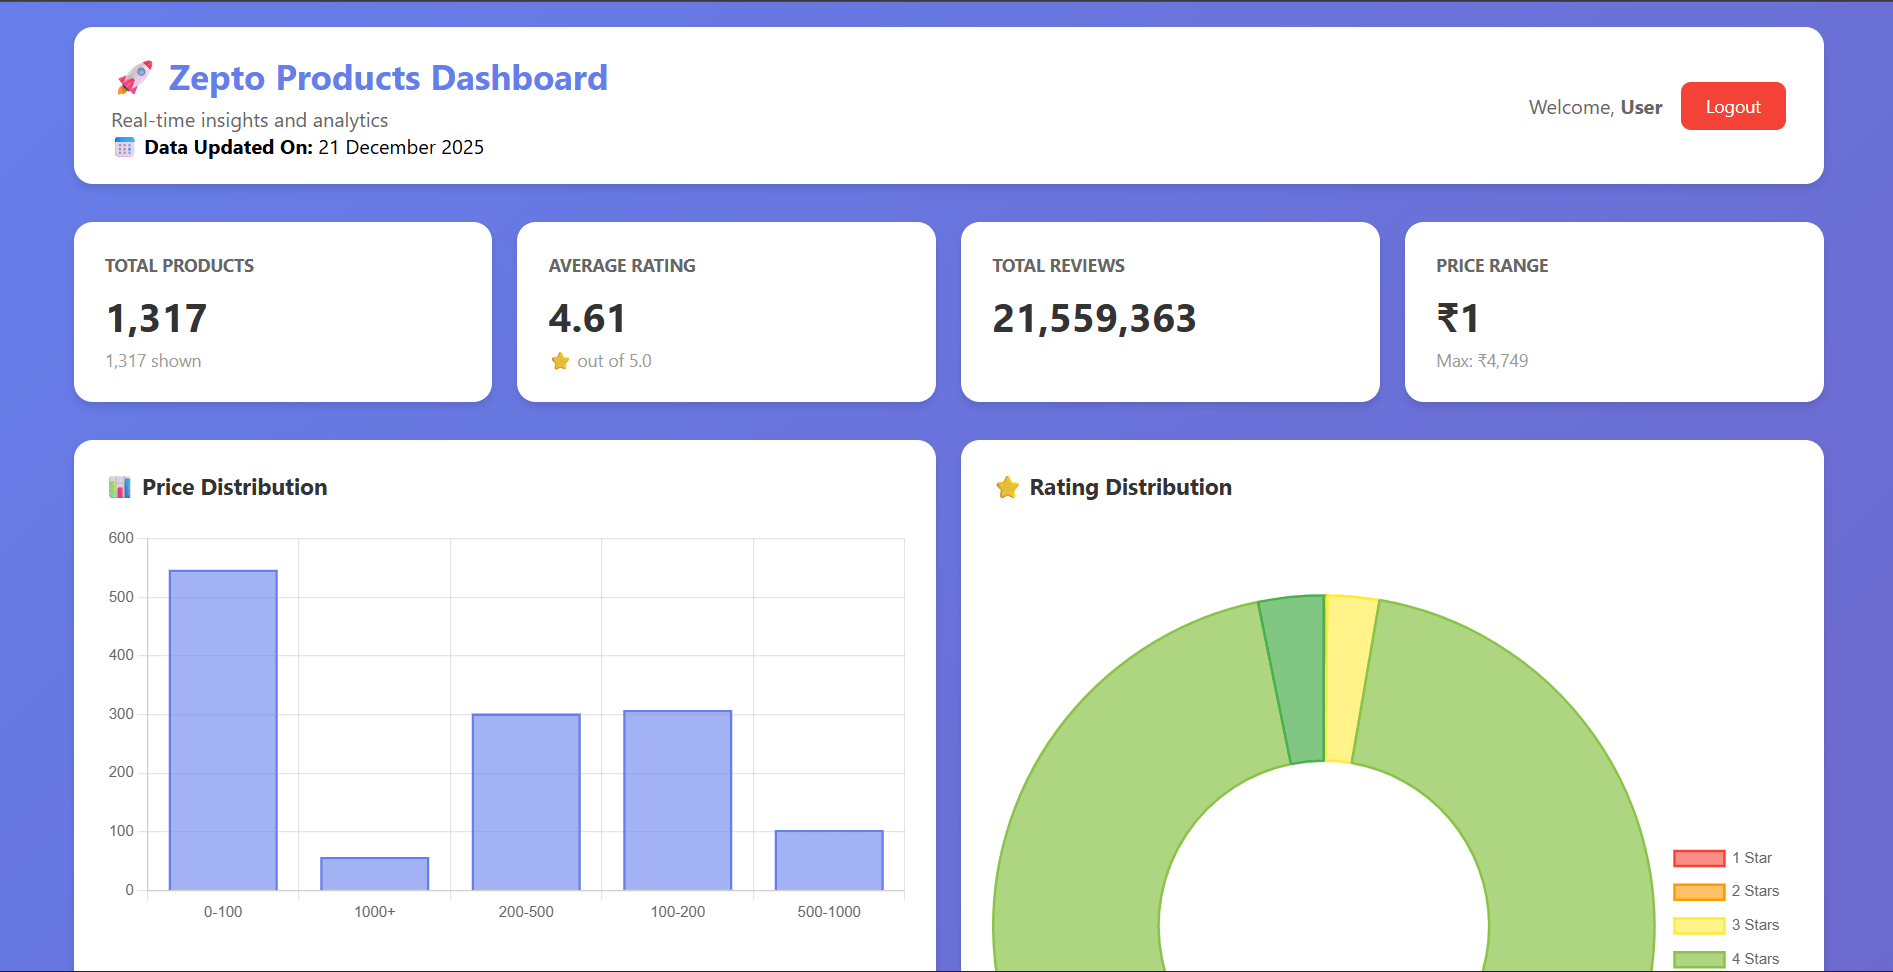
In 2026, quick commerce dashboards transform scraped data into actionable insights, driving 15-30% improvements in pricing and inventory. With market GMV at US$6.94 billion, tools like Python and Tableau are essential. ScraperScoop builds custom pipelines for real-time visualization. This guide covers setup, techniques, ROI, and compliance.
The Need for Real-Time Dashboards in Quick Commerce
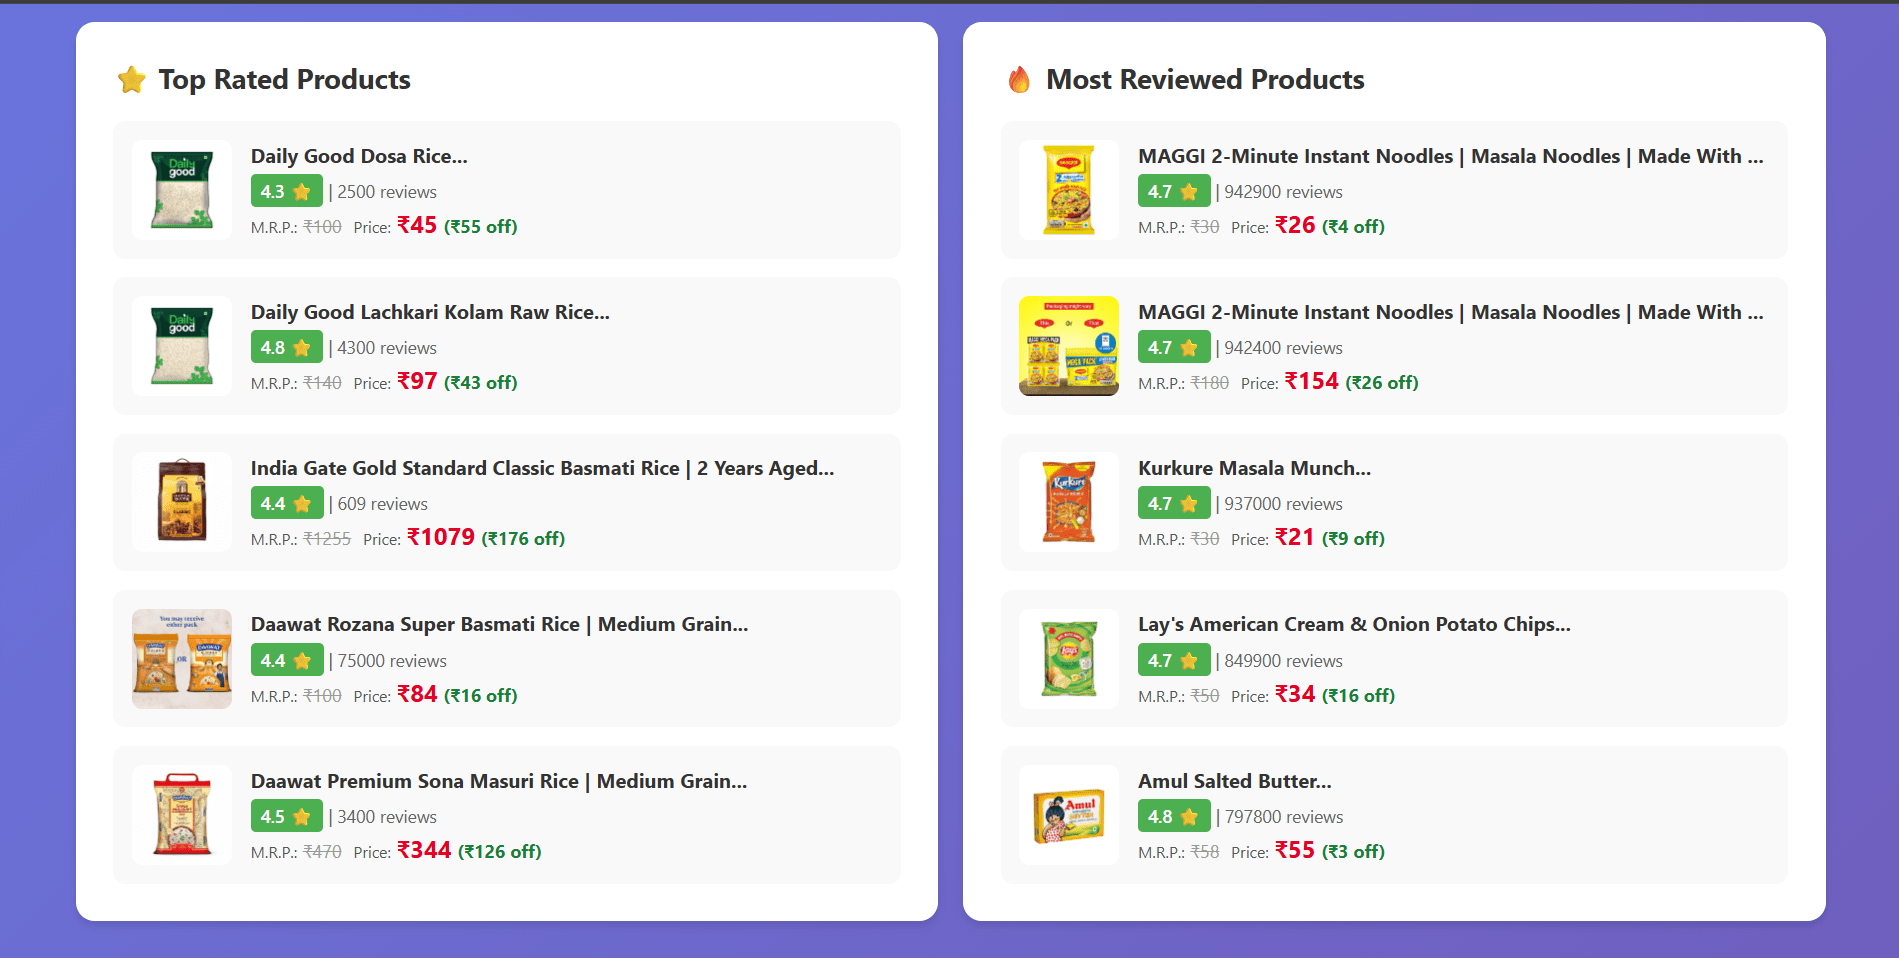
Monitor thousands of SKUs across platforms. Mordor Intelligence projects growth to USD 6.64 billion by 2031.
Tools and Techniques for Dashboard Creation
Use Pandas for data processing, Plotly for visuals. Integrate scraped APIs for live updates.
- Python-based custom dashboards.
- Alert systems for price changes.
ROI Examples and Implementation
Clients see 20% margin gains. Start with MVP for 50 SKUs.
Compliance and Best Practices
Ethical proxies ensure sustainability under DPDPA.
Request a free consultation
Ready to unlock the power of data?
Published: February 2026 | Category: Data Visualization, Quick Commerce